Lipidomics
My very first experience in research with Heather Bradshaw at Indiana University. I helped her process and analyze the data from a large lipidomics project, where she was looking at levels of different lipids in several areas of the brain using an acute model peripheral inflammation.
Overview
Professor Heather Bradshaw gave me my first opportunity in research (and has been generally been an amazing mentor to me), and I am forever indebted to her for that. This opportunity involved me analyzing a ton of data from lipidomics projects she had been working on. I know I won’t do the motivation and explanation of these projects any justice, as they are almost ten years in my past (which is quite long ago for me), but I’ll try to give a basic run-down of the main ideas.
Background and main findings
The background motivation for this research is the opportunity for endogenous cannabinoids (endocannabinoids) to be an option for treatment of some instances of acute inflammation, which is more desirable than opioid options. There had been previous research which suggested that endocannabinoids were part of stress-induced analgesia in the midbrain, and Heather was curious if this was also the case in other areas of the brain, such as the brainstem, thalamus and cerebellum. In previous studies, only two endocannabinoids had been looked at, but for this project we casted a large net and screened for nearly eighty others! In a model of acute peripheral inflammation in mice, we found that there were quite a few changes in the levels of the various lipids in the treatment group — i.e. various endocannabinoids were found to be associated with the pain response in mice.
Mass spectrometry
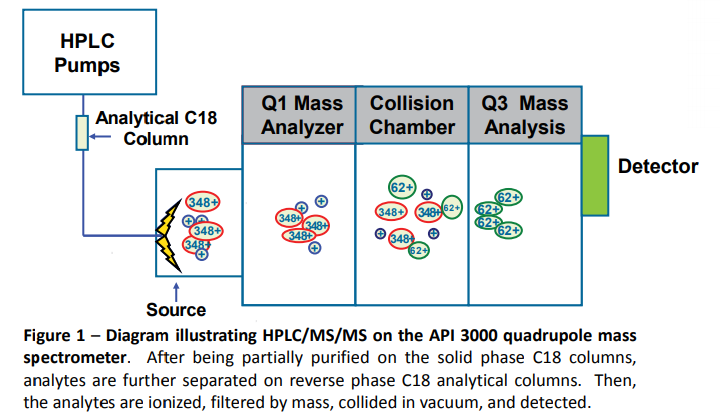
It feels like a completely different life, to be honest, but back in Heather’s lab I was heavily involved in mass spectrometry, which is the method by which we measured the various lipids in the different areas of the brain. The main idea behind this is that we can measure the presence of different molecules by filtering by their mass. There are well established processes to do this filtering and then detection, so we took samples from the mice brains and performed one of these processes, where we knew how each different compound should behave based on their mass. You can see a diagram from the poster I presented at the International Cannabinoid Research Symposium (ICRS) below.

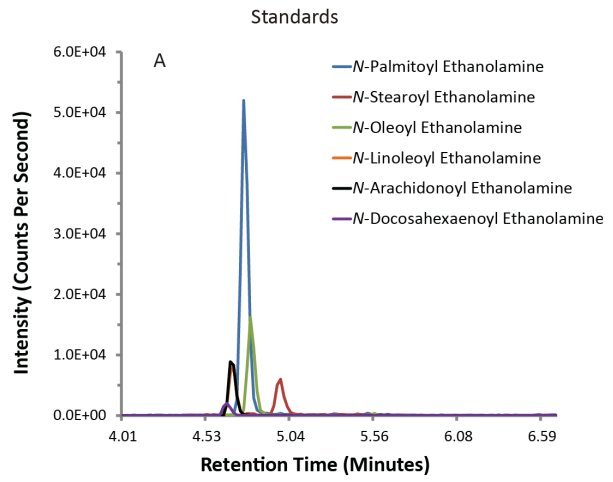
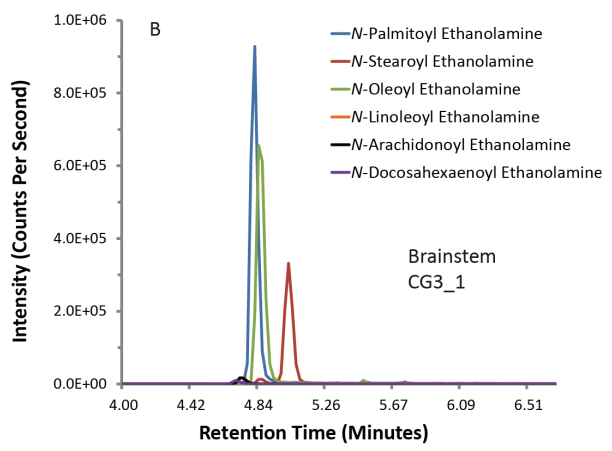
Typical plots from mass spectrometry look like the ones below. On the left, you have a control batch of the compounds (standard), and on the right you have those compounds found out in the ‘wild’, which in our case was a mouse brain.


Upshot
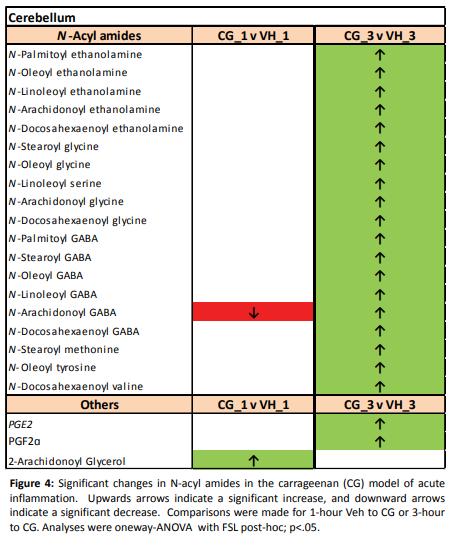
There were quite a few findings since we did such a large screen, but below is a table showing an example of what the results looked like. We reported significant increases or decreases in the levels of various lipids for a particular area of the brain. Now that I think about it, there may be a multiple testing issue that we didn’t account for, so I will look at that and make sure it is not a problem.

More information
There is a lot of other information on this batch of projects. There are a couple of papers I co-authored, which you can find on my publications page or directly here and here. As mentioned earlier, I also presented this work as a poster at the 2012 International Cannabinoid Research Symposium (ICRS) in Freiburg, Germany. That trip with everyone from the lab was the trip of a lifetime, and I can not thank enough Heather and the ICRS for the funding, as I was a bushy-tailed, starry-eyed and broke freshman.